
PE Emulation With Code Coverage Using Qiling and Dragon Dance
Qiling Emulation
The Qiling emulation framework was built with the goal of emulating shellcode from various operating systems due to the ever-increasing amount of complexity of shellcode, as xwings stated in his talk at ZeroNights 2019. The framework, however, evolved into a binary instrumentation and binary emulation framework that supports cross-platform and multi-architecture where multiple architectures (such as ARM and x86), operating systems (such as Windows and Linux) and file formats for loading binary code (such as ELF and Portable Executables) are supported.
Portable Executable Code Coverage
While looking at ways to contribute and improve coverage for the Windows operating system APIs it has been difficult to trace execution flow within a binary that is calling specific APIs that I would like to emulate. Fortunately, @assaf_carlsbad submitted a PR which would do exactly this with DRCOV-compatible code coverage collection. This, however, was limited to the Portable Executable UEFI loader, so I decided to add support for the Windows Portable Executable loader with the following changes:
diff --git a/qiling/loader/pe.py b/qiling/loader/pe.py
index b6e46c8e..3375bbf2 100644
--- a/qiling/loader/pe.py
+++ b/qiling/loader/pe.py
@@ -87,15 +87,20 @@ class Process():
                 self.ql.nprint("[+] Cached %s" % path)

         dll_base = self.dll_last_address
+
         dll_len = self.ql.os.heap._align(len(bytes(data)), 0x1000)
         self.dll_size += dll_len
         self.ql.mem.map(dll_base, dll_len, info=dll_name)
         self.ql.mem.write(dll_base, bytes(data))
         self.dll_last_address += dll_len

+
         # add dll to ldr data
         self.add_ldr_data_table_entry(dll_name)

+        # add DLL to coverage images
+        self.images.append(self.QlImage(dll_base, dll_len, path))
+
         self.ql.nprint("[+] Done with loading %s" % path)
         return dll_base

@@ -328,6 +333,8 @@ class QlLoaderPE(QlLoader, Process):
             self.pe_image_address = self.pe_image_address = self.pe.OPTIONAL_HEADER.ImageBase
             self.pe_image_address_size = self.pe_image_address_size = self.pe.OPTIONAL_HEADER.SizeOfImage

+            self.images.append(self.QlImage(self.pe_image_address, self.pe_image_address + self.pe_image_address_size, self.path))
This, in turn, provides code coverage for any Portable Executable image loaded by the loader (including DLL dependencies) and will cause each basic block executed to be logged by the block_callback function when tracing is enabled:
    def block_callback(ql, address, size, self):
        for mod_id, mod in enumerate(ql.loader.images):
            if mod.base <= address <= mod.end:
                ent = bb_entry(address - mod.base, size, mod_id)
                self.basic_blocks.append(ent)
                break
I had left this blog on the backburner for a while, and later found that xwings had already added this for PEs in June, so I submitted a PR to add the DLL coverage as well.
Enter the Dragon (Dance)
The defacto standard for visualizing code coverage in IDA Pro and Binary Ninja is a plugin called Lighthouse, which I’d highly recommend checking out if you’re reverse engineering using these disassemblers. During my off-time, I’ve been trying to use Ghidra, which has a great disassembler and decompiler, and provides a plethora of features that are missing from IDA Pro. Once you get used to its quirks, it’s a fantastic free and open source software reverse engineering suite. I came across a fantastic plugin called Dragon Dance which provides similar functionality to Lighthouse for visualizing code coverage within Ghidra, and most importantly for this post, supports the DRCOV trace format. It supports a number of built-in references which let you do things like diff traces within the highlighted syntax. Here’s a nice depiction from the README of using the scripting interface with these functions:

In addition to this, Dragon Dance supports fixups, which essentially looks at the coverage integrity within the binary and compares this to instructions which have been disassembled by Ghidra. If these differ, then the plugin will prompt the user to fix these areas which Ghidra missed. Here’s a depiction of this below, also from the README:

Putting It All Together
Now that we have Portable Executable trace coverage, and a way to visualize it within a reverse engineering suite, let’s take a look at an example. Qiling comes with a WannaCry binary which we’ll use to demonstrate code coverage here. First, I needed to follow the build instructions within Dragon Dance, which were very straight forward, in order to build and install the plugin. Once this was done and I had it working in Ghidra, I ran qltool with the WannaCry binary and tracing enabled:
# python qltool run --disasm -c wannacry-trace.cov -f examples/rootfs/x86_windows/bin/wannacry.bin --rootfs examples/rootfs/x86_windows/
[+] Initiate stack address at 0xfffdd000
[+] Loading examples/rootfs/x86_windows/bin/wannacry.bin to 0x400000
[+] PE entry point at 0x409a16
[+] TEB addr is 0x6000
[+] PEB addr is 0x6044
[+] Loading examples/rootfs/x86_windows/Windows/SysWOW64/ntdll.dll to 0x10000000
[+] Done with loading examples/rootfs/x86_windows/Windows/SysWOW64/ntdll.dll
[+] Loading examples/rootfs/x86_windows/Windows/SysWOW64/kernel32.dll to 0x10141000
[+] Done with loading examples/rootfs/x86_windows/Windows/SysWOW64/kernel32.dll
[+] Loading examples/rootfs/x86_windows/Windows/SysWOW64/advapi32.dll to 0x10215000
[+] Done with loading examples/rootfs/x86_windows/Windows/SysWOW64/advapi32.dll
[+] Loading examples/rootfs/x86_windows/Windows/SysWOW64/ws2_32.dll to 0x102b6000
[+] Done with loading examples/rootfs/x86_windows/Windows/SysWOW64/ws2_32.dll
[+] Loading examples/rootfs/x86_windows/Windows/SysWOW64/msvcp60.dll to 0x102eb000
[+] Done with loading examples/rootfs/x86_windows/Windows/SysWOW64/msvcp60.dll
[+] Loading examples/rootfs/x86_windows/Windows/SysWOW64/iphlpapi.dll to 0x10351000
[+] Done with loading examples/rootfs/x86_windows/Windows/SysWOW64/iphlpapi.dll
[+] Loading examples/rootfs/x86_windows/Windows/SysWOW64/wininet.dll to 0x1036d000
[+] Done with loading examples/rootfs/x86_windows/Windows/SysWOW64/wininet.dll
[+] Loading examples/rootfs/x86_windows/Windows/SysWOW64/msvcrt.dll to 0x10462000
[+] Done with loading examples/rootfs/x86_windows/Windows/SysWOW64/msvcrt.dll
-snip-
[+] 0x408171       50                            push eax
[+] 0x408172       50                            push eax
[+] 0x408173       50                            push eax
[+] 0x408174       6a 01                         push 1
[+] 0x408176       50                            push eax
[+] 0x408177       88 44 24 6b                   mov byte ptr [esp + 0x6b], al
[+] 0x40817b       ff 15 34 a1 40 00             call dword ptr [0x40a134]
[+] 0x1039c18e     8b ff                         mov edi, edi
InternetOpenA(lpszAgent = 0x0, dwAccessType = 0x1, lpszProxy = 0x0, lpszProxyBypass = 0x0, dwFlags = 0x0)
[+] 0x408181       6a 00                         push 0
[+] 0x408183       68 00 00 00 84                push 0x84000000
[+] 0x408188       6a 00                         push 0
[+] 0x40818a       8d 4c 24 14                   lea ecx, [esp + 0x14]
[+] 0x40818e       8b f0                         mov esi, eax
[+] 0x408190       6a 00                         push 0
[+] 0x408192       51                            push ecx
[+] 0x408193       56                            push esi
[+] 0x408194       ff 15 38 a1 40 00             call dword ptr [0x40a138]
[+] 0x103b00f1     8b ff                         mov edi, edi
InternetOpenUrlA(hInternet = 0x0, lpszUrl = "http://www.iuqerfsodp9ifjaposdfjhgosurijfaewrwergwea.com", lpszHeaders = 0x0, dwHeadersLength = 0x0, dwFlags = 0x84000000, dwContext = 0x0)
[+] 0x40819a       8b f8                         mov edi, eax
[+] 0x40819c       56                            push esi
[+] 0x40819d       8b 35 3c a1 40 00             mov esi, dword ptr [0x40a13c]
[+] 0x4081a3       85 ff                         test edi, edi
[+] 0x4081a5       90                            nop
[+] 0x4081a6       90                            nop
[+] 0x4081a7       ff d6                         call esi
[+] 0x10387b49     8b ff                         mov edi, edi
InternetCloseHandle(hInternet = 0x0) = 0x1
-snip-
A few options to make note of that are passed to qltool:
--disasmprovides the disassembly of all executed instructions-cprovides the DRCONV output trace file path
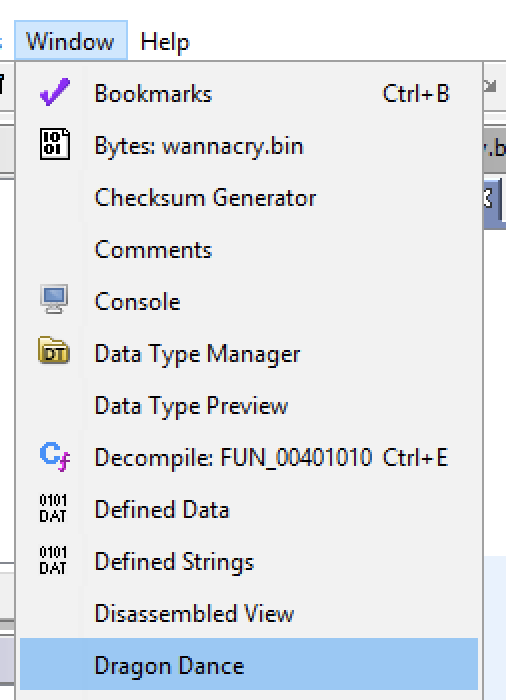
As you can see, the infamous killswitch URL hxxp://www.iuqerfsodp9ifjaposdfjhgosurijfaewrwergwea[.]com was passed to InternetOpenUrlA within our emulation run. Now, let’s import this trace into Ghidra using Dragon Dance and see what it looks like. Once the plugin is installed, we can open the plugin window from the Window dropdown within Ghidra:
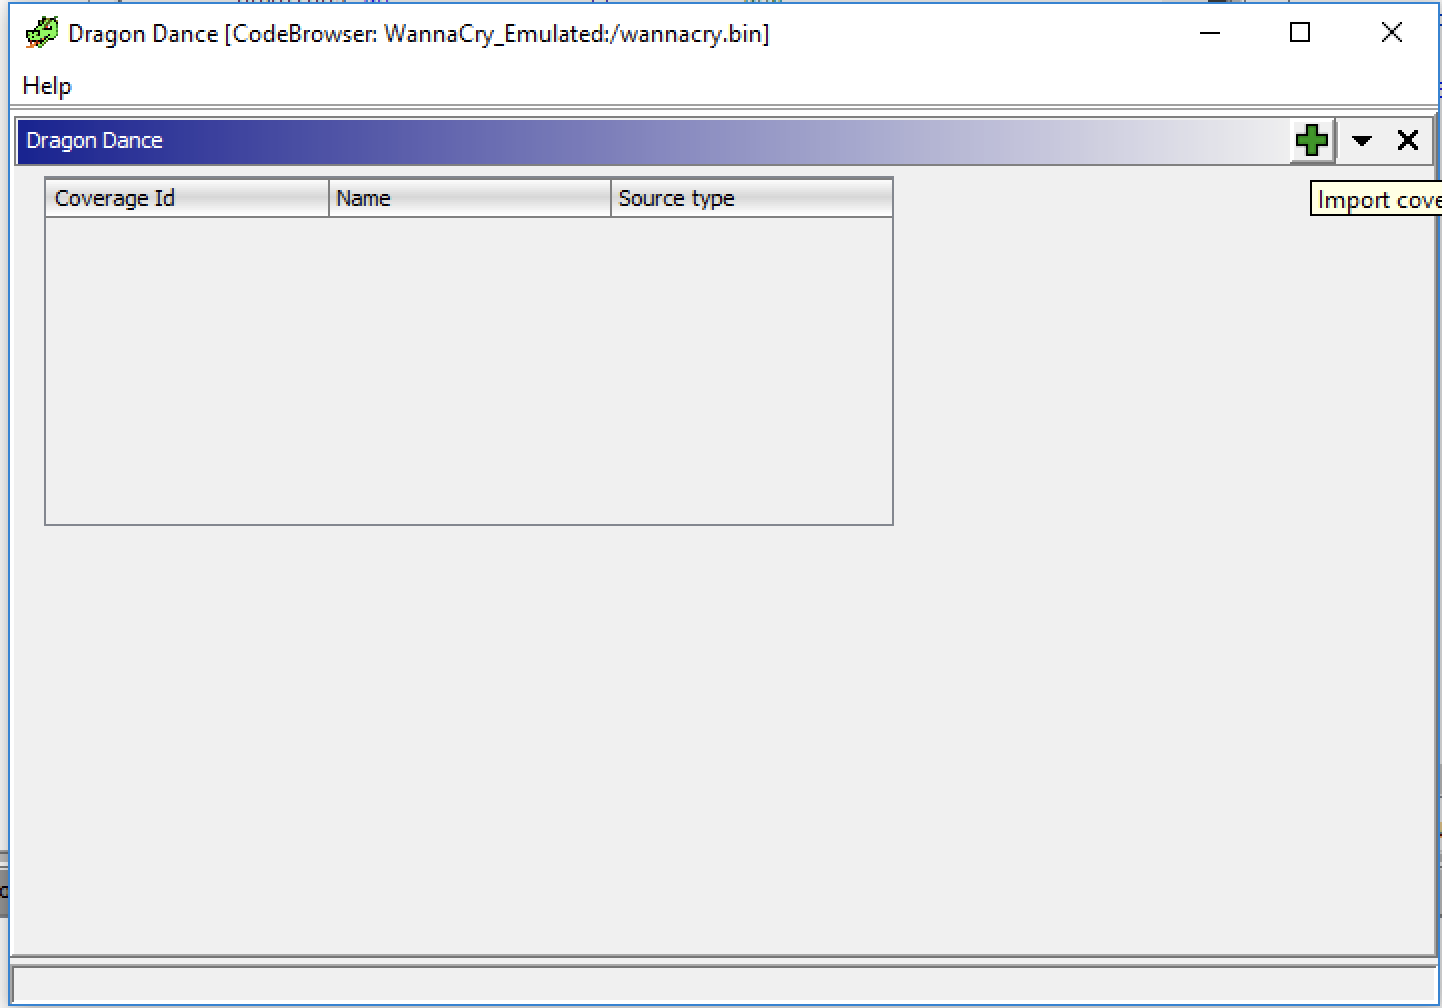
Once the Dragon Dance window is open, we can add a trace file using the green + button:
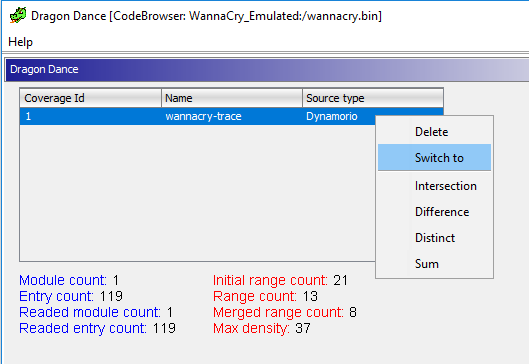
Once added, we can switch to this trace by right clicking on the trace file and clicking Switch To:
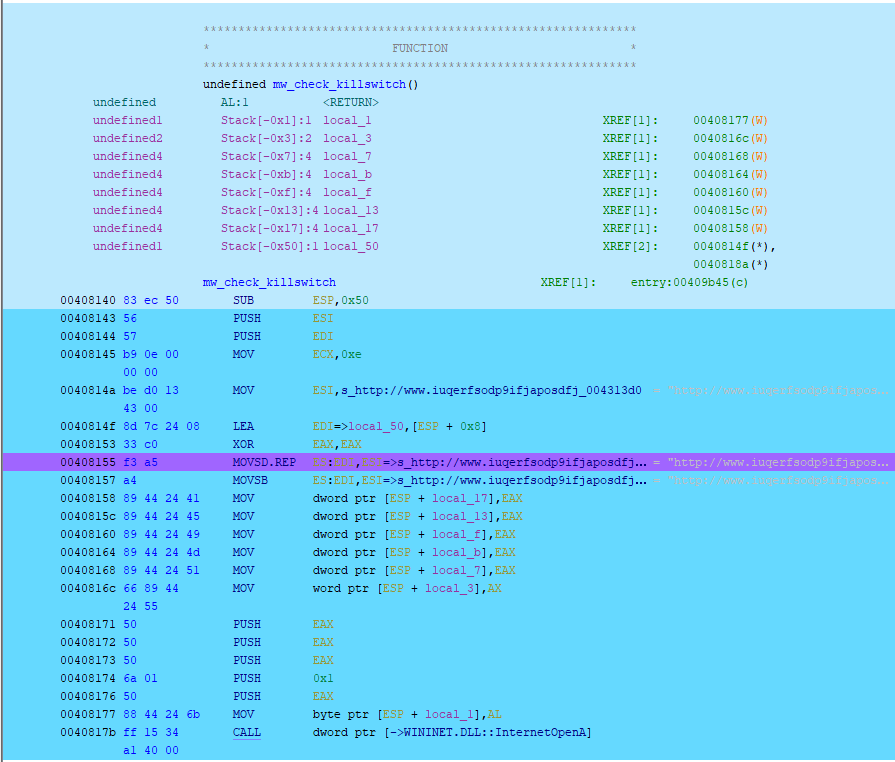
Once applied, all executed/emulation areas of the binary are now highlighted. Here we can see the killwitch function that is called by the WannaCry binary:
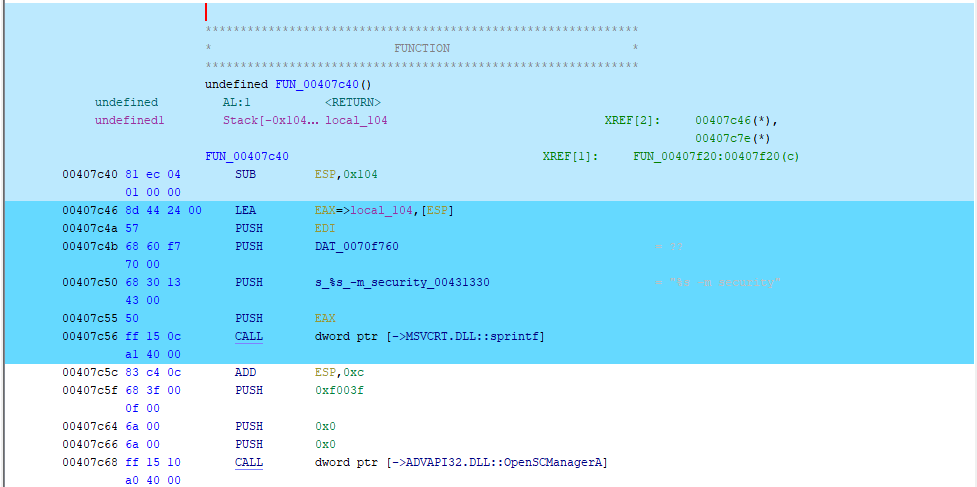
If you’ve followed along you’ll see that the emulation of the WannaCry binary dies within the sprintf function:
[+] 0x4080a5       ff 15 2c a1 40 00             call dword ptr [0x40a12c]
[+] 0x104b5aa9     b8 e4 30 ff 6f                mov eax, 0x6fff30e4
__p___argc() = 0x5053d44
[+] 0x4080ab       83 38 02                      cmp dword ptr [eax], 2
[+] 0x4080ae       7d 09                         jge 0x4080b9
[+] 0x4080b0       e8 6b fe ff ff                call 0x407f20
[+] 0x407f20       e8 1b fd ff ff                call 0x407c40
[+] 0x407c40       81 ec 04 01 00 00             sub esp, 0x104
[+] 0x407c46       8d 44 24 00                   lea eax, [esp]
[+] 0x407c4a       57                            push edi
[+] 0x407c4b       68 60 f7 70 00                push 0x70f760
[+] 0x407c50       68 30 13 43 00                push 0x431330
[+] 0x407c55       50                            push eax
[+] 0x407c56       ff 15 0c a1 40 00             call dword ptr [0x40a10c]
[+] 0x1047f354     8b ff                         mov edi, edi
[!] sprintf Exception Found
[!] Emulation Error
-snip-
  File "/qiling/qiling/os/windows/windows.py", line 115, in hook_winapi
    raise QlErrorSyscallError("[!] Windows API Implementation Error")
qiling.exception.QlErrorSyscallError: [!] Windows API Implementation Error
Below we can see no further instruction highlights in Ghidra after the call to sprintf within msvcrt.dll:
We can, however, visualize the code coverage within the msvcrt.dll dependency itself using Dragon Dance, which is where the exception occurred:
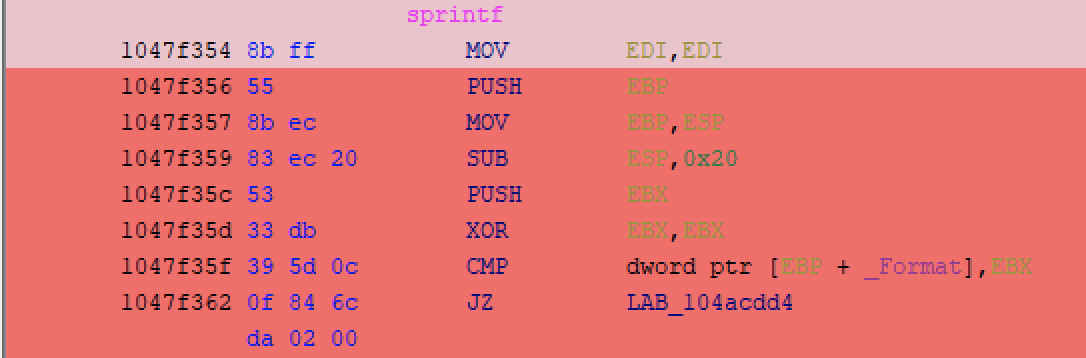
There is a limitation that I ran into though, since Qiling executes blocks of machine code with Unicorn. If an exception occurs while executing a given block (which is the case here) then it might not hit the logging callback once it produces an exception. The visualization, however, still gives you an idea of where the issue is occurring. If we wanted the binary to continue executing, we’d have to take one of two approaches:
- Figure out why execution is failing within the library function
sprintfwithinmsvcrt.dllwhich is resulting in theWindows API Implementation Error - Implement the API ourselves within Qiling so it is supported
The former requires reverse engineering of a Windows DLL, where the latter requires us to work out what sprintf does and implement it within the Qiling framework.
Conclusion
This is a basic example of debugging emulated output, since it’s obvious from the qltool output what is happening, however, being able visualize execution paths for more complex binaries is invaluable, since many branches can be taken to get to a certain function where an error or undefined behavior may be occurring. The Qiling framework is being actively developed and I see updates from it on Github almost daily. The core developers have done a great job at maintaining the project, and I’d suggest using techniques like these to debug APIs and contribute to the project.
Happy Hacking!